Travel Fatigue Indicators That Alter Point Spread Calculations in Overseas Basketball Tours
Written by Sofia Schmid · Jun 15, 2026
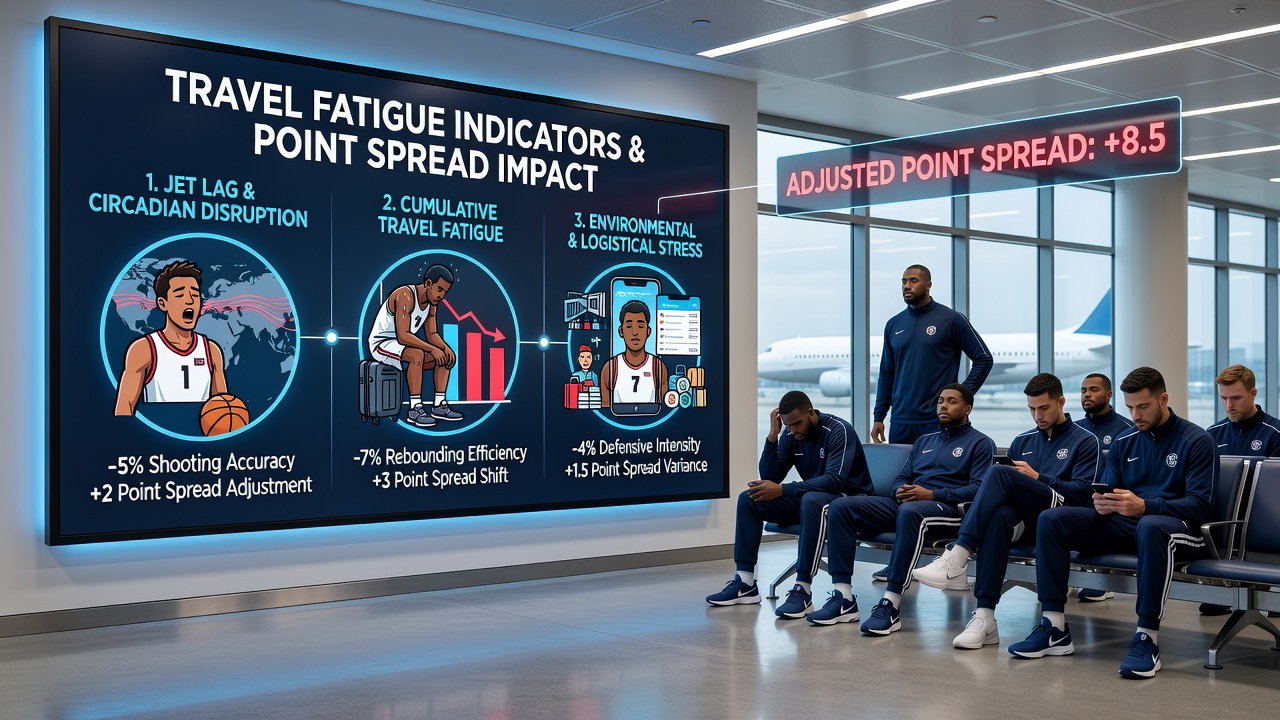
Travel Fatigue Indicators That Alter Point Spread Calculations in Overseas Basketball Tours
Travel fatigue emerges as a measurable factor in overseas basketball tours where teams cross multiple time zones and contend with disrupted sleep cycles along with altered training schedules. Data from international competitions shows that recovery timelines stretch beyond 48 hours after flights exceeding eight hours, and these delays directly influence team performance metrics used in point spread models. Analysts track variables such as average minutes played per player, three-point shooting percentages, and defensive rebound rates, all of which shift when squads operate under accumulated travel stress rather than optimal rest conditions.
Core Physiological Markers Tracked by Performance Models
Researchers monitor heart rate variability and sleep duration through wearable devices during long-haul trips, and these readings feed into algorithms that adjust expected margins of victory. A drop in heart rate variability below baseline levels by 15 percent often correlates with reduced sprint output in the first three quarters, while players averaging under six hours of sleep per night record a measurable decline in assist-to-turnover ratios. Studies conducted during the 2025-2026 season documented these patterns across multiple continents, and the resulting datasets now inform updated spread calculations for upcoming events scheduled through June 2026.
Teams traveling from North America to Asia or Europe experience the sharpest adjustments because circadian rhythm disruptions compound with changes in humidity and court surfaces. Performance tracking firms collect granular box score data from these tours and cross-reference it against pre-travel baselines, which allows them to quantify how fatigue alters offensive efficiency ratings by as much as 8 to 12 points per 100 possessions in the initial games of a series.
Statistical Adjustments Applied to Point Spread Formulas
Model builders incorporate travel distance, number of time zones crossed, and days since last game as weighted inputs, and they apply regression analysis to historical results from FIBA and NBA exhibition events. One dataset compiled from tours between 2022 and 2025 revealed that visiting teams covering more than 10,000 kilometers posted winning percentages 6.4 points lower than their season averages when playing within 72 hours of arrival. These findings prompted revisions to spread calculations that now subtract additional points for squads with back-to-back long-haul flights, while adding small buffers for teams granted extra recovery days.
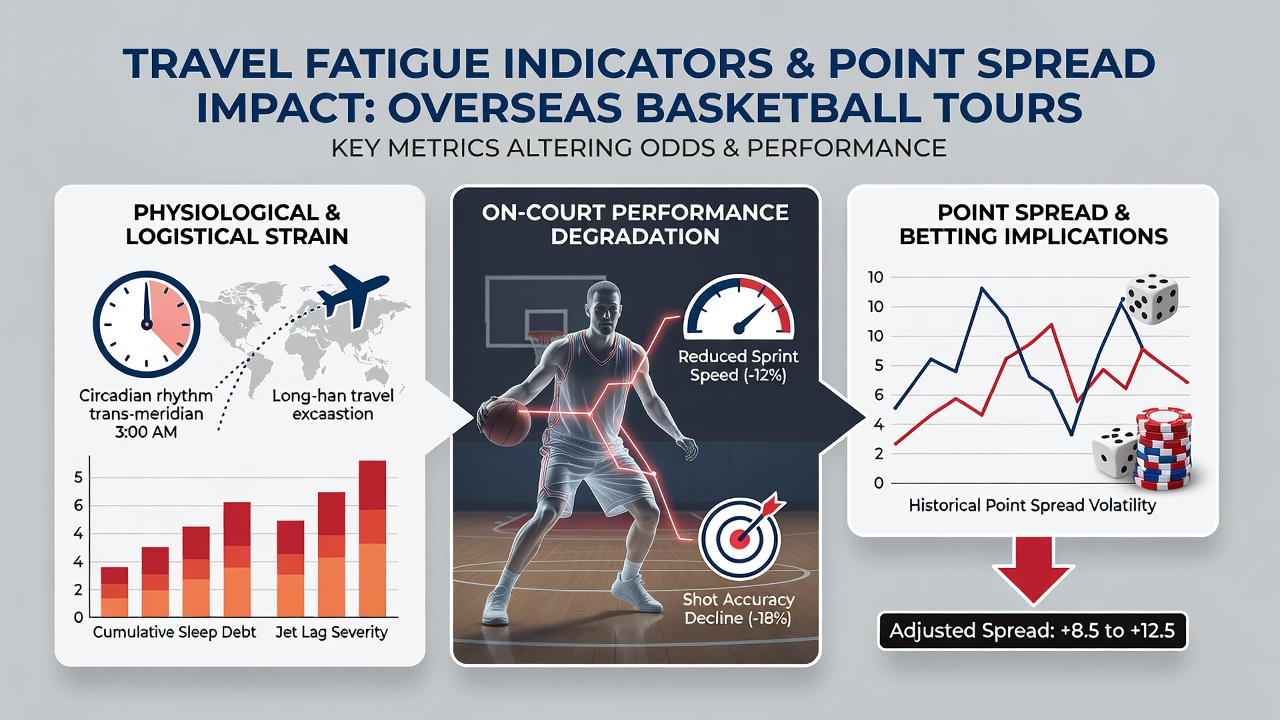
Betting markets have begun reflecting these updated indicators through line movements observed 24 to 48 hours before tip-off. When public betting volume concentrates on the home side without accounting for the visitor's travel burden, the resulting spread widens by one to three points compared to neutral-site projections. Data providers release daily fatigue indices that combine flight logs, player tracking information, and injury reports, and these indices serve as inputs for both professional handicappers and automated systems.
Regional Examples from Recent International Schedules
European clubs hosting North American squads in June 2026 face distinct patterns because summer tours often pack multiple games into tight windows with limited rest. Records from previous exhibitions show that teams arriving from the eastern United States into central Europe record elevated foul rates in the second half, a trend attributed to slower reaction times under fatigue. Meanwhile, squads traveling westward across the Pacific exhibit early-game scoring droughts that resolve only after the third quarter once bodies acclimate to local conditions.
Performance analysts at organizations such as the International Olympic Committee athlete monitoring program have published reports detailing how cumulative travel loads affect decision-making speed during high-stakes contests. Their findings align with observations from Australian sports institutes that tracked similar variables during pre-Olympic preparation tours, and both sources emphasize the value of multi-day acclimatization periods before competitive play resumes.
Integration of Fatigue Data into Live Betting Adjustments
Live models update spreads after each quarter by factoring in real-time indicators such as pace deviations and substitution frequency. When a team exceeds its season average in timeouts called during the first half, this often signals elevated fatigue and prompts algorithms to shift totals downward for the remainder of the contest. Historical comparisons across overseas tours indicate that such adjustments improve predictive accuracy by roughly 4 percent when applied consistently.
Coaching staffs share anonymized recovery data with league statisticians in select partnerships, which allows broader industry access to metrics previously held internally. These shared datasets highlight connections between travel fatigue and specific skill categories, including mid-range jump efficiency and help-side defense rotations, both of which degrade predictably after extended flights.
Conclusion
Point spread calculations for overseas basketball tours continue to evolve as more granular travel fatigue indicators enter mainstream analysis. Performance data collected through June 2026 and beyond will likely refine existing formulas further, and observers note that teams and markets alike benefit when these physiological and logistical variables receive systematic treatment alongside traditional box score statistics.