Surface Transitions in ATP Tournaments: How Court Speed Changes Reshape Player Performance Metrics for Strategic Wagers
Written by Petra Frank · Aug 17, 2026
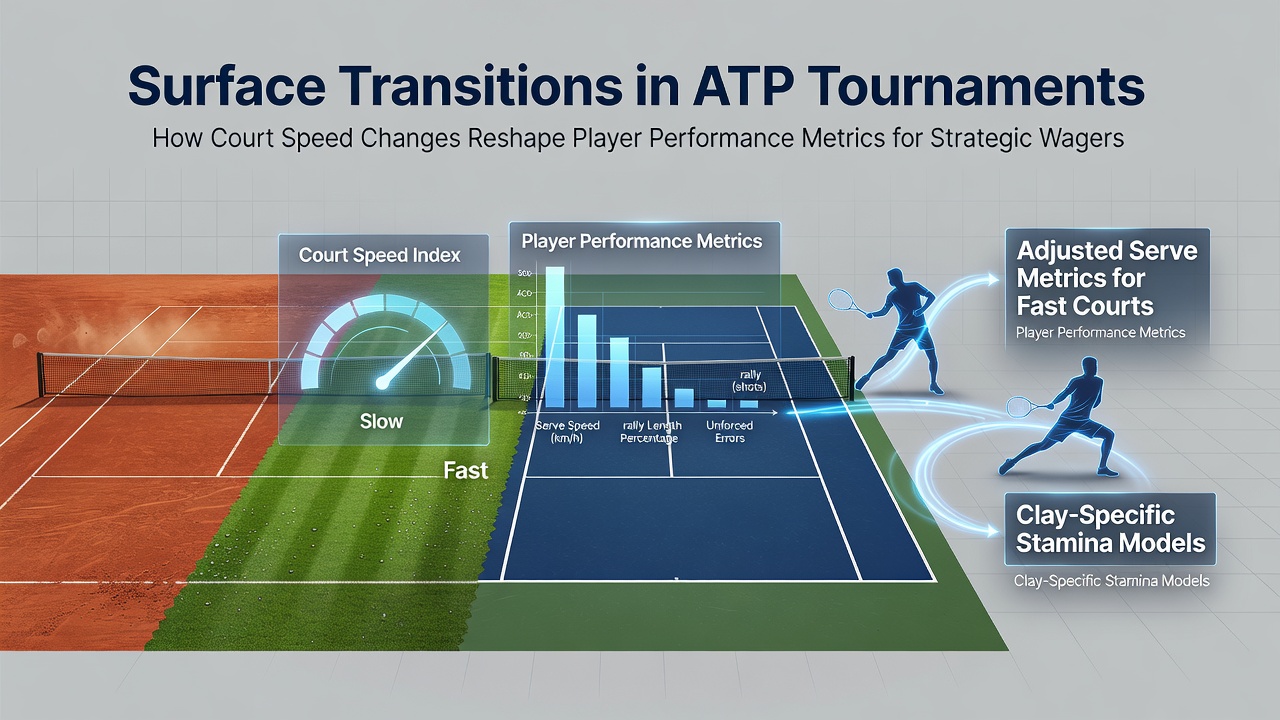
Surface Transitions in ATP Tournaments: How Court Speed Changes Reshape Player Performance Metrics for Strategic Wagers
Data from ATP events across multiple surfaces indicates that court speed alterations directly influence key performance indicators such as first-serve percentages, rally durations, and winner-to-error ratios, while these shifts occur consistently during the transition from European clay swings to North American hard courts each summer. Observers note that slower surfaces extend average rally lengths by 15 to 25 percent according to tracking systems used at major tournaments, whereas faster conditions compress those same rallies and elevate ace frequencies by similar margins.
Core Surface Characteristics and Speed Variations
ATP tournaments employ three primary surfaces with distinct pace profiles, and hard courts sit in the middle range while clay slows ball velocity through higher friction and grass accelerates it via lower bounce. Researchers at the International Tennis Federation have documented that ball rebound speeds drop by up to 12 percent on clay compared with medium-paced hard courts, yet they rise by 8 to 10 percent on grass, and these measurements come from standardized testing protocols applied before each event. Players encounter these changes sequentially during the season calendar, so performance databases record corresponding adjustments in stroke selection and movement patterns.
Clay courts demand greater topspin and defensive positioning because the ball sits up longer, whereas grass rewards flatter trajectories and quicker net approaches, and data compiled by tournament statisticians shows baseline winners increase on slower surfaces while serve-and-volley attempts rise on faster ones. Hard court transitions in late summer therefore create measurable resets in player output because the medium pace allows both aggressive and counterpunching styles to coexist within the same match.
Metric Shifts During Seasonal Transitions
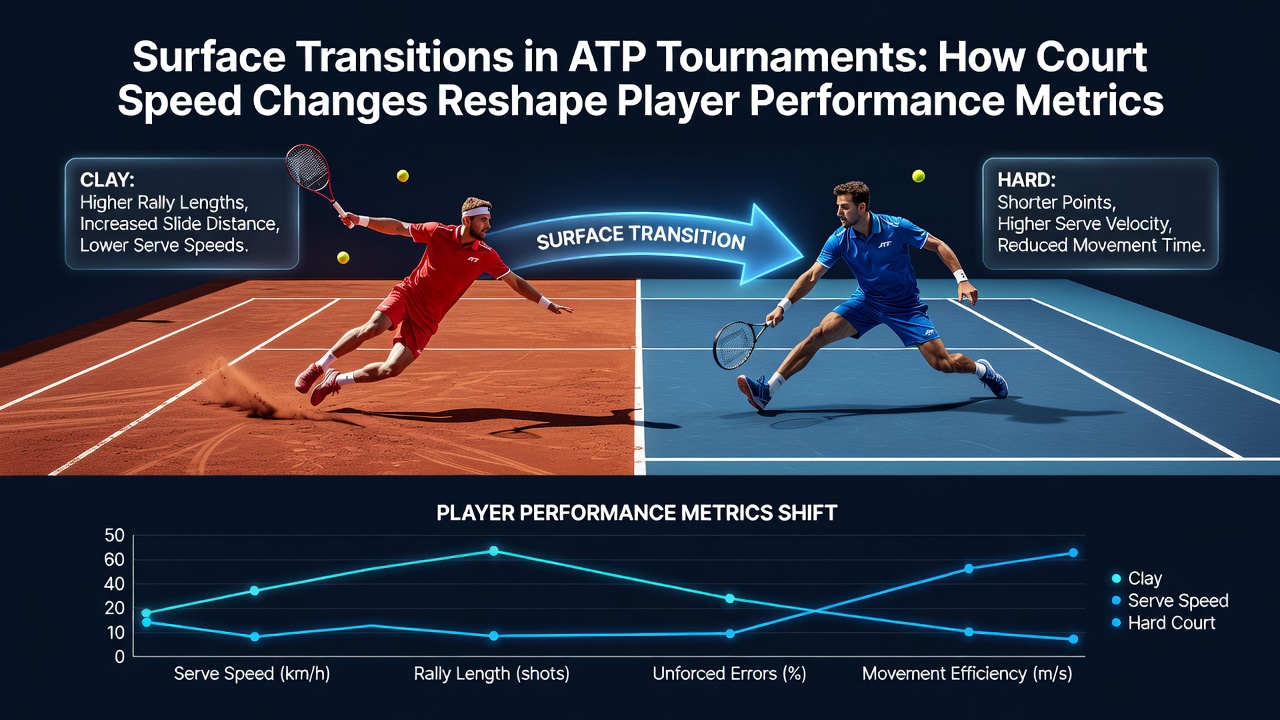
Performance analytics platforms track how metrics evolve when players move between surfaces, and figures from 2025 events reveal that first-serve win rates climb 4 to 6 percentage points on grass compared with clay while second-serve return points won drop by roughly the same amount. These patterns emerge because faster courts reduce reaction time and favor players who generate high serve speeds, yet slower courts extend rallies and reward consistency over raw power.
Break-point conversion rates also fluctuate, with data showing higher conversion on clay due to longer exchanges that expose serve vulnerabilities, whereas grass events produce fewer breaks overall because holds become more common. In August 2026 the North American hard-court swing will again test these dynamics as competitors arrive from the clay-court circuit, and analysts expect similar metric realignments based on historical datasets maintained by the ATP.
Player-Specific Responses and Statistical Patterns
Individual athletes display predictable adaptations when court speeds change, and those who excel on clay often post elevated unforced error counts during the first week on faster hard courts because their topspin-heavy strokes require adjustment time. Tracking data indicates that players with strong serve metrics on grass maintain higher ace percentages when conditions remain dry, while baseline-oriented competitors record increased rally-win percentages once surfaces slow after rain or humidity.
Studies conducted by academic sports science departments in Australia have confirmed that movement efficiency declines temporarily during surface switches because footwork patterns optimized for one pace become less effective on another, and recovery metrics such as distance covered per point rise on slower courts. These observations appear across multiple seasons and support the use of surface-adjusted performance models when evaluating upcoming matches.
Applications in Performance Evaluation
Comprehensive datasets now integrate court speed coefficients into player profiles, allowing comparisons that account for surface effects rather than raw totals alone. Organizations such as the Tennis Integrity Unit reference these adjusted figures when reviewing match statistics, and the approach reveals which competitors consistently outperform their surface-adjusted benchmarks. Tournament organizers publish pace ratings for each event, and these ratings correlate strongly with observed changes in winner production and error rates.
External sources including reports from the United States Tennis Association further document how regional climate influences effective court speed beyond the surface material itself, with higher temperatures increasing pace on hard courts and altering spin retention on clay. Such environmental variables add another layer to the metric shifts already driven by surface type.
Conclusion
ATP performance records demonstrate that court speed transitions produce repeatable changes in serve efficiency, rally duration, and error distribution, and these patterns remain visible across seasons regardless of individual player rankings. Continued collection of surface-specific data supports more precise evaluation of match outcomes as the calendar moves through its annual cycle of surface changes.