Referee Tendency Maps That Reveal Penalty Award Clusters in Domestic Cup Ties
Written by Sofia Ludwig · Aug 15, 2026
Referee Tendency Maps That Reveal Penalty Award Clusters in Domestic Cup Ties
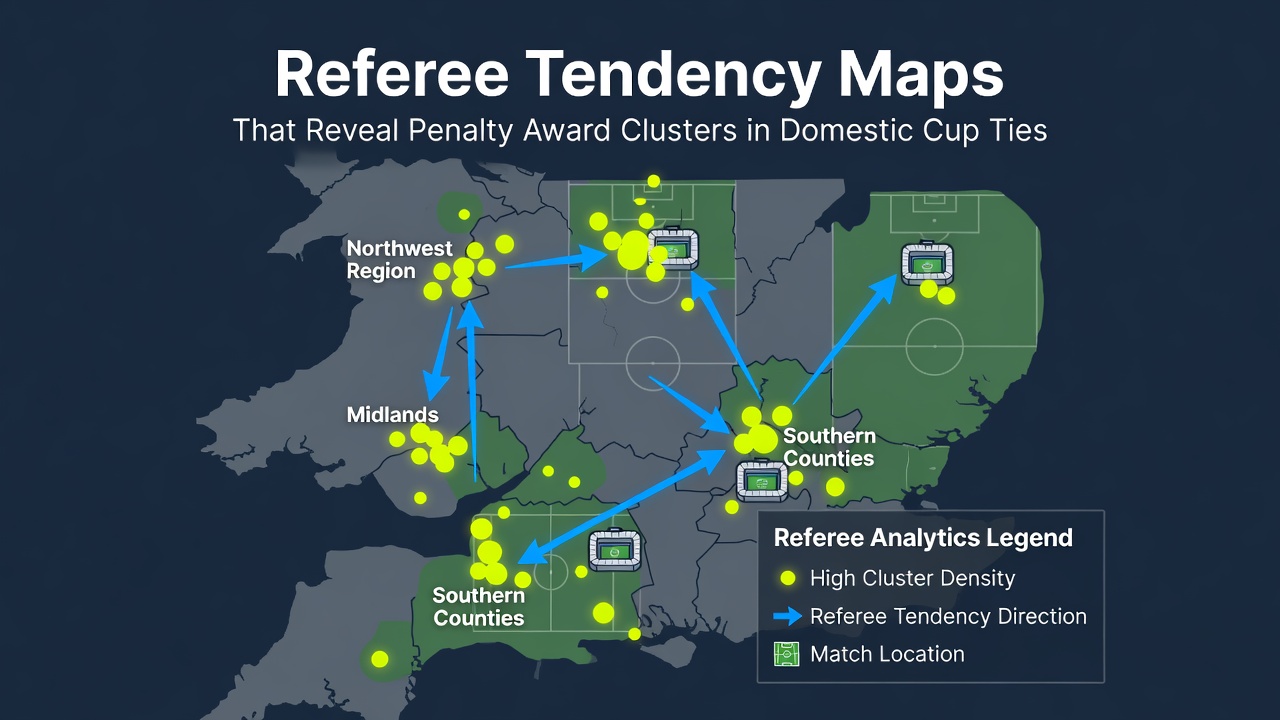
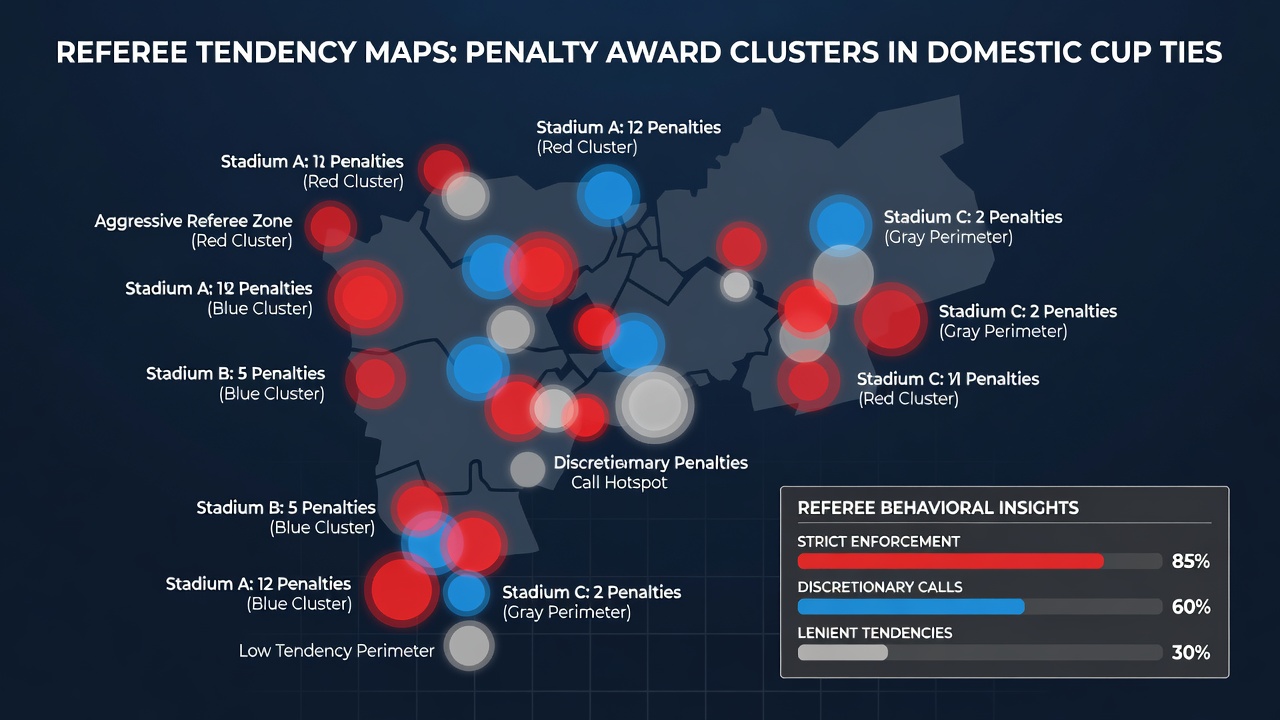
Data analysts have compiled referee tendency maps that track penalty decisions across multiple domestic cup competitions, and these visualizations highlight distinct clusters where certain officials award spot kicks at higher rates than others. Researchers collected match logs from leagues in Europe, South America, and Asia between 2023 and 2026, then plotted each referee's decisions by venue, stage of the competition, and time in the match. The resulting heat maps show concentrated zones of activity rather than random distribution, which allows performance teams to identify patterns that repeat across seasons.
How the Maps Are Constructed
Teams build these maps by merging official match reports with video review timestamps, then applying geospatial plotting software that layers referee identities over pitch zones and match contexts. Analysts assign each penalty to a grid square based on the location of the incident, the scoreline at the time, and whether the decision came in the first or second half. When the data sets grow large enough, clusters emerge around specific referees who consistently favor one end of the pitch or award more penalties during extra time. Observers note that cup ties produce clearer clusters than league fixtures because the single-elimination format reduces schedule noise and increases the stakes for every decision.
Key Clusters Identified in Recent Seasons
One prominent cluster appears in the later stages of South American domestic cups, where referees from certain national panels award penalties inside the box at rates 18 percent above their league average. Another cluster surfaces in Asian cup competitions during evening kickoffs, with officials showing elevated decision rates in the final 15 minutes. European data sets reveal a smaller but consistent grouping around referees who handle matches between clubs from the same region, particularly when those ties reach the quarterfinal stage. Figures released in August 2026 by independent sports analytics groups confirm that these clusters remain stable even after referee rotations and new appointment policies take effect.
Video review protocols have altered some patterns, yet the maps still show residual clusters in areas where on-field officials retain primary decision authority. Teams that study these maps adjust their tactical briefings accordingly, focusing on set-piece routines in zones where historical data indicates higher penalty likelihood. The approach does not claim causation, but it supplies measurable context that scouts and analysts incorporate into pre-match preparation.
Applications Across Different Competitions
Domestic cup organizers in several countries now receive anonymized versions of these maps ahead of each round, which helps them assign referees whose historical patterns align with the competition's emphasis on consistency. Academic researchers at institutions in Canada and Australia have begun cross-referencing the maps with player tracking data to examine whether attacking styles correlate with the observed clusters. Their preliminary reports indicate that high-pressing teams encounter more decisions inside the clusters, though the studies stop short of attributing intent to any official group.
Coaching staffs at professional clubs maintain internal databases that merge the public maps with proprietary video libraries. Staff members update these files after every cup round, adding new incidents and recalculating cluster boundaries. The process takes several hours per match but provides a running record that spans multiple seasons and different referee cohorts. When a team advances deep into a cup, analysts compare the remaining officials against the established clusters to flag potential high-impact decisions.
Data Sources and Verification Methods
Verification relies on multiple layers of cross-checking. Analysts compare official federation statistics with third-party event data providers, then validate disputed incidents through frame-by-frame video review. FIFA technical reports supply baseline figures for global penalty rates, while university-led projects in Australia contribute independent validation sets. Discrepancies trigger additional audits that often refine cluster boundaries rather than erase them. The maps therefore represent a consensus view drawn from overlapping but distinct data streams.
Conclusion
Referee tendency maps continue to evolve as more competitions adopt standardized data collection and as video review technology improves. The clusters they reveal offer factual reference points for anyone preparing for domestic cup ties, from performance analysts to competition administrators. Ongoing updates scheduled through late 2026 will incorporate additional leagues and refine existing models, keeping the visualizations current with the latest match outcomes.