Recovery Windows in Condensed Fixtures Shape Multi-Sport Accumulator Construction
Written by Felix Schmid · Jun 17, 2026
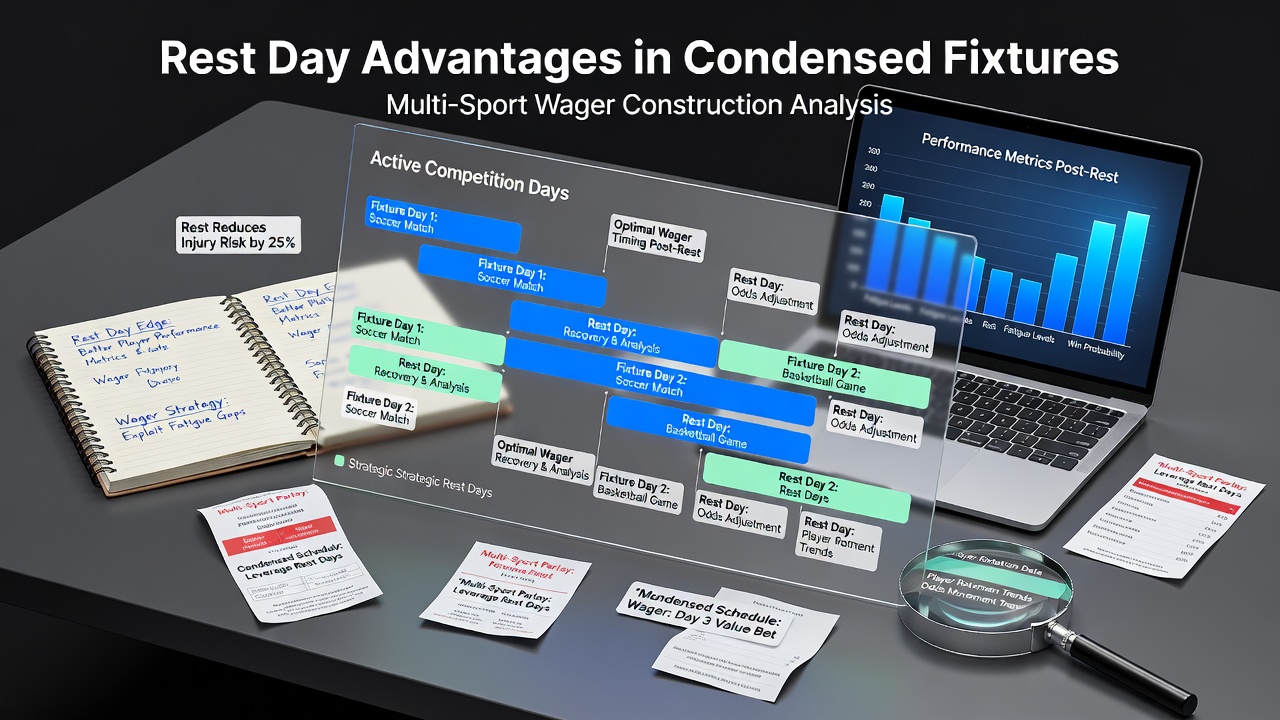
Recovery Windows in Condensed Fixtures Shape Multi-Sport Accumulator Construction
Condensed fixture lists across major leagues create measurable recovery differentials that influence player output and team totals, and analysts track these gaps when assembling multi-sport wagers. Leagues such as the Premier League, NBA, and various European domestic cups routinely compress schedules around international breaks or playoff pushes, leaving some squads with extra rest days while others play on short turnaround. Data from performance tracking platforms shows that teams receiving at least two full rest days before a match post higher shooting percentages and lower turnover rates in basketball, while soccer sides with similar recovery margins record elevated pass completion figures in the final third.
Fixture Congestion Patterns Across Sports
June 2026 brings another wave of overlapping club and international commitments, with several leagues extending seasons into early summer to accommodate expanded tournament formats. Observers note that clubs contesting both domestic cups and continental competitions often face three matches inside eight days, whereas teams eliminated early enjoy longer preparation windows. Researchers who examined five seasons of NBA back-to-back data found that second-night win percentages drop by roughly six points when travel exceeds 1,000 miles, yet the same study recorded neutral or positive results when the preceding game occurred at home with two days between contests.
Soccer provides parallel examples during spring title races. A review of Bundesliga and Serie A schedules between 2022 and 2025 indicated that sides playing 48 hours after their previous fixture averaged 0.3 fewer expected goals per match than squads with three or more rest days. Those margins widen when matches occur on artificial surfaces or in high temperatures, conditions that accelerate fatigue accumulation according to sports-science reports compiled by university laboratories in Germany and Italy.
Statistical Edges Tied to Rest Differentials
Bet constructors examine rest-day splits when linking selections across sports because recovery effects appear consistent enough to model. One dataset covering NBA regular-season games from 2018 onward reveals that teams with three-plus rest days cover the over in player prop points roughly 52 percent of the time when facing opponents on zero or one rest day. Parallel soccer metrics show an uptick in corner counts when the home side enjoys an extra recovery day, particularly in matches involving high-pressing teams.
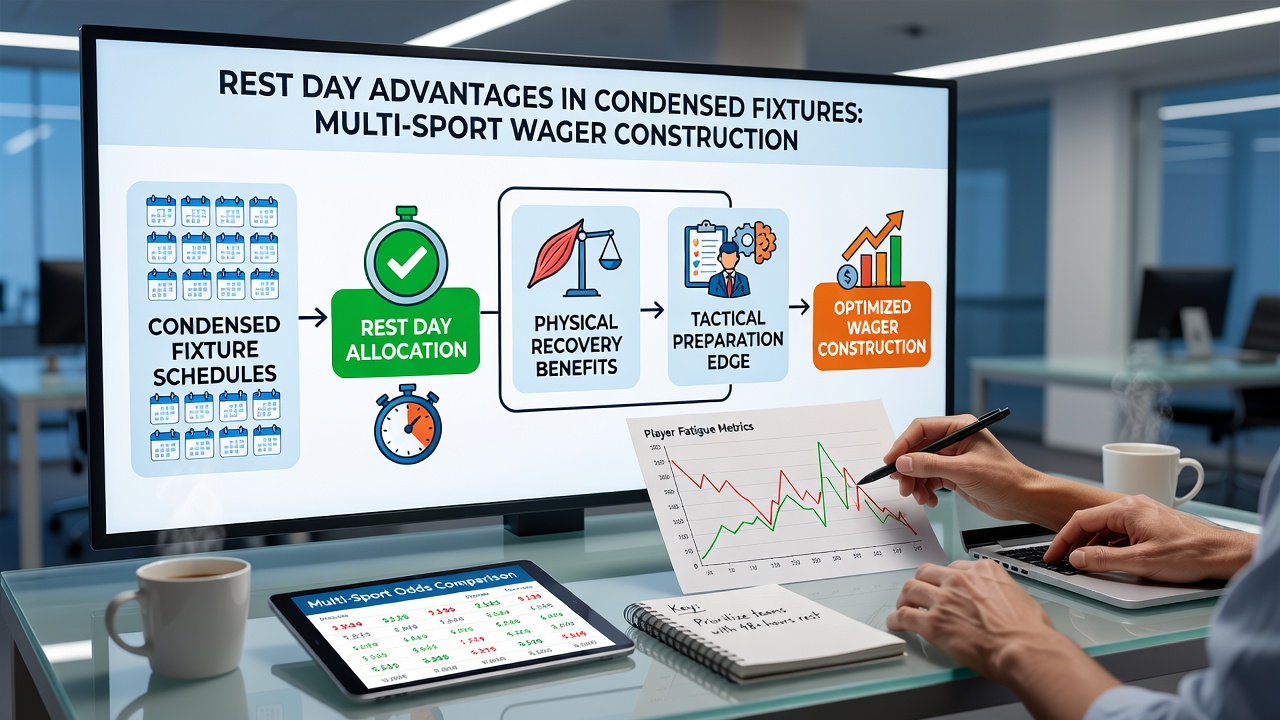
Multi-sport accumulators gain structure when builders pair a rested NBA underdog with a soccer side that avoided midweek travel. The combination reduces variance because each leg draws from independent recovery advantages rather than correlated form streaks. Analysts cross-reference training-load data released by clubs through wearable technology summaries, noting that elevated neuromuscular fatigue markers correlate with reduced high-intensity runs in the second half of soccer matches and diminished three-point volume in basketball.
Integrating Recovery Data Into Wager Construction
Practical application begins with calendar mapping. Builders list upcoming fixtures, flag squads with rest disparities, then filter for markets sensitive to those gaps such as team totals, player assists, or set-piece volume. External benchmarks help calibrate expectations. A longitudinal project conducted by the International Journal of Sports Physiology and Performance tracked elite athletes across two Olympic cycles and confirmed that a minimum of 72 hours between matches preserves sprint speed and decision-making accuracy at levels comparable to pre-season baselines.
June 2026 schedules already show several instances where clubs finish European campaigns and immediately enter domestic playoffs. Builders who isolate these transitions often locate value in unders on total goals or points during the first leg after return, because collective training intensity typically remains moderated for 48 to 72 hours. Conversely, opponents who maintained regular domestic rhythms during the same period frequently sustain higher pressing intensity and therefore generate more turnovers.
League-Specific Recovery Benchmarks
Different sports publish varying recovery guidelines. NBA teams average 1.4 days between regular-season games, yet playoff schedules stretch some intervals to three days, producing documented spikes in fourth-quarter scoring once both clubs reach equal rest footing. Soccer governing bodies in Spain and France have introduced minimum rest mandates for youth academies, and early compliance data released by those federations indicate reduced soft-tissue injury rates when clubs adhere to the thresholds. These benchmarks supply objective filters when wager constructors evaluate player props or team totals across condensed periods.
Travel distance compounds rest effects. A review of transatlantic NBA trips between 2021 and 2025 demonstrated that teams arriving within 24 hours of tip-off cover the spread at lower rates than clubs that land two days earlier. Soccer sides navigating short-haul European flights exhibit similar patterns, with expected goal differentials narrowing when the away squad receives an extra night in the host city.
Conclusion
Rest-day differentials supply a repeatable framework for multi-sport wager construction because performance data across basketball and soccer consistently links recovery windows to measurable output changes. Builders who map fixture calendars, cross-check training-load indicators, and align selections around verified rest advantages create accumulators grounded in observable patterns rather than narrative form streaks. As schedules grow denser through 2026, those same recovery metrics remain central to identifying edges that persist across independent sporting codes.