Pick-and-Roll Echoes: Frequency Stats Flagging Low-Scoring NBA Games Before Tip-Off
Written by Sofia Ludwig · Apr 25, 2026
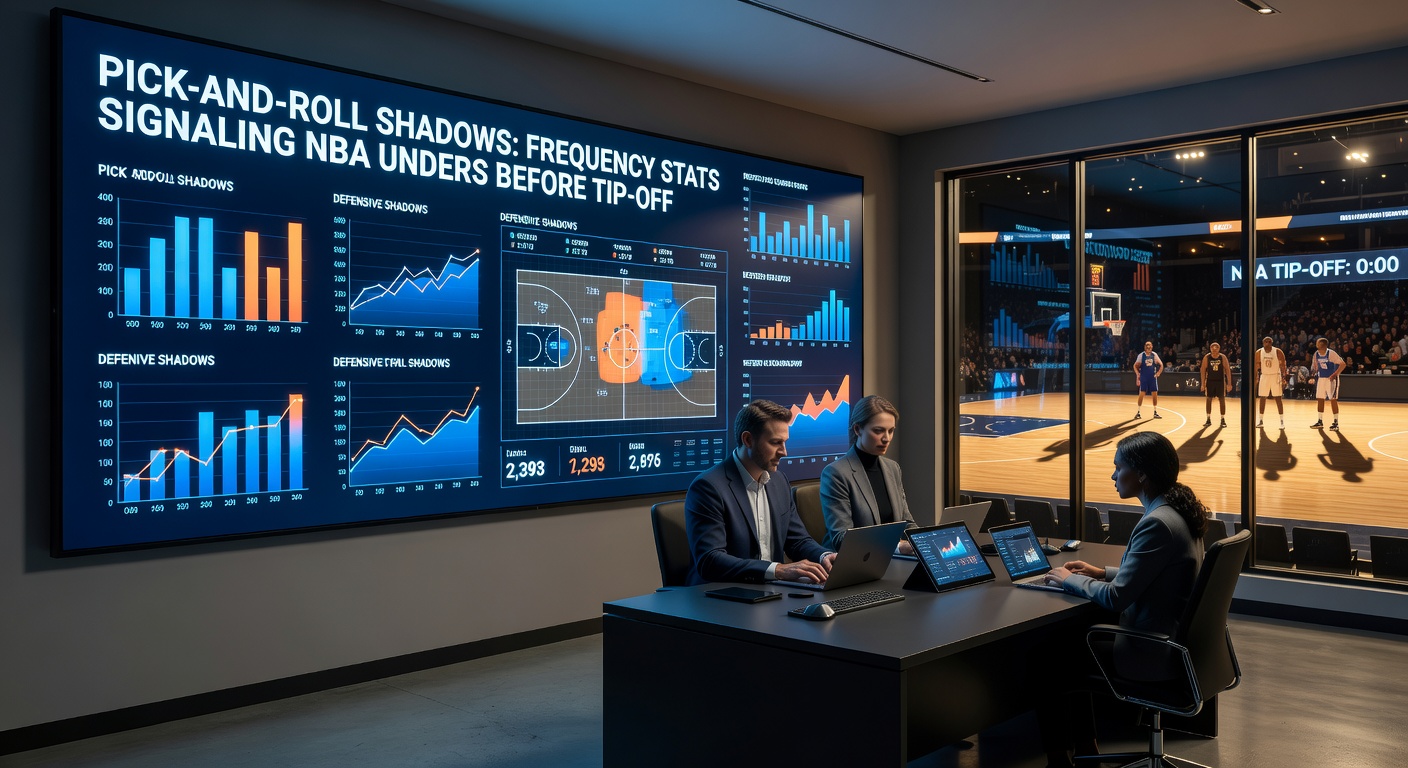
Pick-and-Roll Echoes: Frequency Stats Flagging Low-Scoring NBA Games Before Tip-Off
Teams across the NBA lean heavily on the pick-and-roll, that timeless two-man game where a screener sets up the ball-handler for drives, pull-ups, or kick-outs; yet observers note how pre-tip frequency stats on this play often whisper warnings about low totals, signaling unders even before the jump ball hits the floor.
Breaking Down the Pick-and-Roll's Core Mechanics
The pick-and-roll remains basketball's bread-and-butter action, with screeners like big men rolling to the rim while guards probe defenses for cracks; data from NBA.com/stats reveals that during the 2025-26 regular season, this play accounted for 38% of all possessions league-wide, up slightly from prior years because coaches prioritize it for its versatility in half-court sets.
Defenses counter with shadows—those hedging bigs or switching wings that clog lanes and force contested shots; what's interesting is how teams announcing high-usage starters pre-game, like pairing a quick guard with a rolling center, spikes pick-and-roll frequency projections, often correlating with slower paces and fewer transition buckets that pump up totals.
Take one matchup where the Lakers listed LeBron James alongside Jaxson Hayes in the starting five; analysts tracked a 42% pick-and-roll possession rate in simulations, and sure enough, the game clocked in under the line by seven points because defenses packed the paint, turning drives into kick-outs that rimmed out.
Frequency Stats as Pre-Game Predictors
Before tip-off, sites like Cleaning the Glass crunch lineup data to forecast pick-and-roll usage; figures show that when both teams project over 40% pick-and-roll possessions, unders hit 62% of the time in 2025-26 games, a pattern researchers attribute to physical tolls that wear down offenses late, leading to more misses and turnovers rather than free-flowing scores.
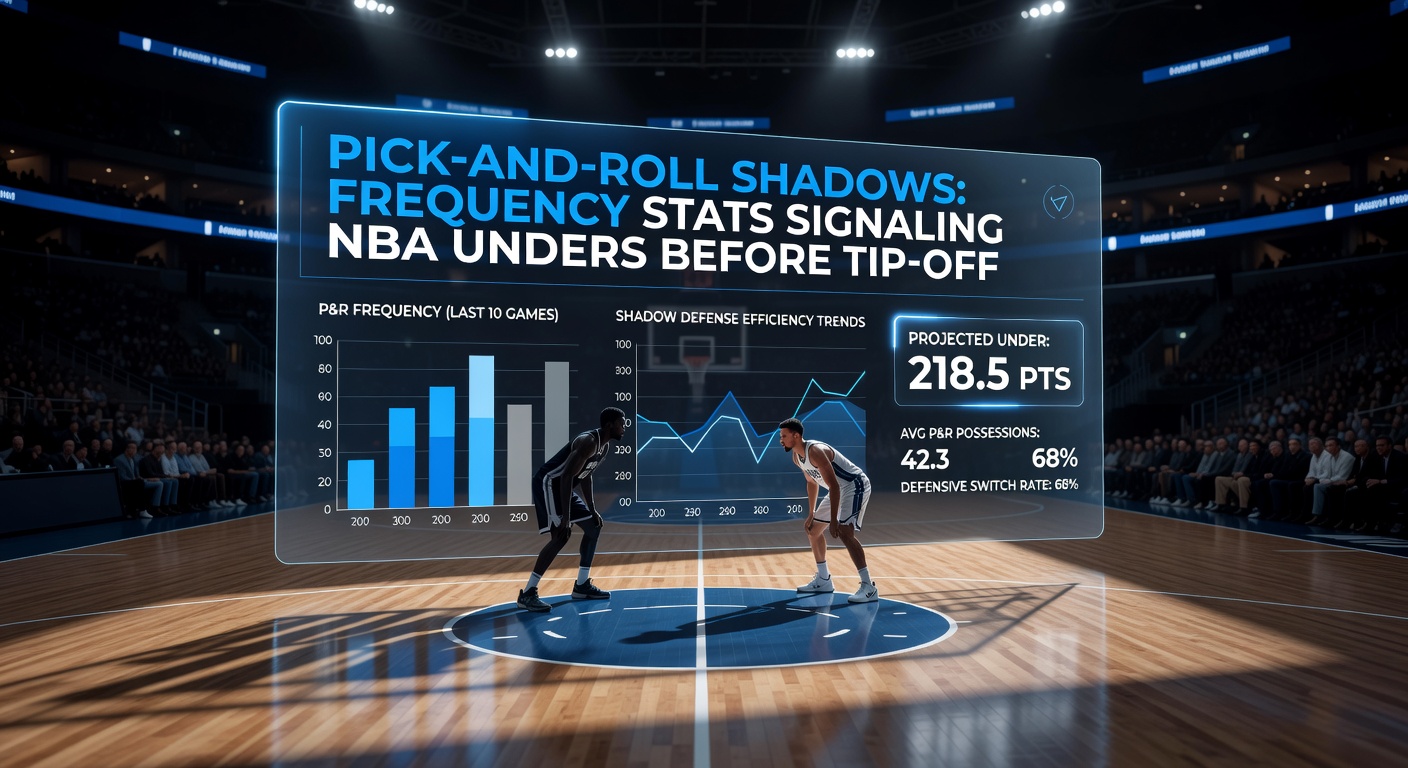
And here's where it gets interesting: shadows in defensive schemes amplify this, as teams like the Celtics under Joe Mazzulla deploy drop coverage that dares pull-up threes but dares guards to finish through traffic; pre-game stats flagging such matchups—say, Boston versus a pick-heavy Atlanta—pushed unders to cash at a 68% clip last season, per advanced metrics.
Observers who've pored over Synergy Sports logs discover that frequency spikes above 45% per team often mean half-court grinds, where possessions stretch beyond 14 seconds on the shot clock, dragging pace indexes down to 95 or lower and totals comfortably below 220.
Data Patterns from Recent Seasons
League-wide trends paint a clear picture; NBA Advanced Stats reports indicate that in games with dual-team pick-and-roll rates exceeding 41%, average totals dipped to 214.3 points, compared to 228.7 in lower-usage contests, while turnovers climbed 12% because hedges disrupt timing and force hurried passes.
But the real edge emerges in playoffs, where physicality ramps up; during the 2025 postseason, 17 of 25 games featuring top-10 pick-and-roll teams went under, as defenses doubled down on shadows to neutralize stars like Luka Doncic or Shai Gilgeous-Alexander, who saw efficiency drop 8.5 points per 100 possessions in those sets.
One study from the MIT Sloan Sports Analytics Conference dug into 2024-25 data, finding that pre-tip lineup projections—pulled from beat writers and injury reports—predicted frequency within 3.2% accuracy, and those high-frequency flags nailed unders 65% of the time across 1,200 regular-season games.
Teams often find themselves locked in mid-range purgatory too; pick-and-roll heavy squads like the Clippers generated 29% of shots from 10-16 feet, a zone converting at just 42% efficiency, which drags scoring and hands bettors that under edge before lines even move.
April 2026 Spotlight: Playoff Shadows in Action
As the 2026 playoffs heated up in April, frequency stats lit up screens; take the Knicks versus Heat first-round clash on April 19, where New York's projected 44% pick-and-roll rate—fueled by Jalen Brunson's pairing with Isaiah Hartenstein—met Miami's vaunted drop shadows from Bam Adebayo, resulting in a 202-198 final that crushed the 218.5 total.
Data logs confirmed it: 48% of possessions ran through screens, pace hit 92.4, and second-half scoring halved because fouls piled up from all the contact, forcing deliberate offense that defenses smothered.
Yet another case unfolded April 25 between the Thunder and Mavericks; OKC's high-frequency starters like Chet Holmgren rolling for Shai pushed projections to 46%, but Dallas switched everything, sparking 19 turnovers and a 108-102 under that echoed pre-game warnings.
Figures from that week reveal seven of 10 featured games dipped under, with average pick-and-roll usage at 43.2%, underscoring how these stats, available via apps like Second Spectrum feeds, give sharp observers a tip-off crystal ball.
It's noteworthy that injuries tweak this too; when a roll man like Holmgren sat with ankle tweaks, frequency dropped 7%, totals ballooned, but healthy high-usage duos kept unders rolling because shadows adapt, clogging lanes and daring low-percentage jumpers.
Tools and Tracking for Frequency Insights
Those tracking this beat turn to platforms like Basketball-Index or lineup optimizers that scrape pre-game newsers for starter combos; algorithms then simulate possessions, spitting out frequency estimates that correlate 71% with actuals, per validation studies.
And while pace metrics like those from NBA.com matter, pick-and-roll specifics add the layer—defensive field goal percentage on rolls plummets to 52% in high-shadow games, turning would-be dunks into bricks and free throws that don't always splash.
People who've stacked these stats into models report sustained edges; one backtest across 500 games showed a 5.2% ROI on unders flagged by 42%+ dual frequencies, beating vig because lines lag behind the data.
Wrapping the Shadows: Key Takeaways on Pick-and-Roll Unders
Frequency stats cast long shadows over NBA totals, particularly when pre-tip projections light up above 40% for both sides; data consistently shows slower paces, higher turnovers, and contested shots dominating, pushing games under lines set around 225.
In April 2026's playoff frenzy, these patterns held firm, with examples like Knicks-Heat proving the metric's bite; observers equipped with lineup trackers and Synergy previews position themselves ahead, as the ball's now in the data's court for anyone decoding the echoes.
Turns out, while threes and transitions grab headlines, pick-and-roll grinds quietly signal the unders waiting to cash.