Assist-to-Turnover Ratios Shape NBA Player Prop Values in Back-to-Back Matchups
Written by Hugo Bauer · Aug 22, 2026
Assist-to-Turnover Ratios Shape NBA Player Prop Values in Back-to-Back Matchups
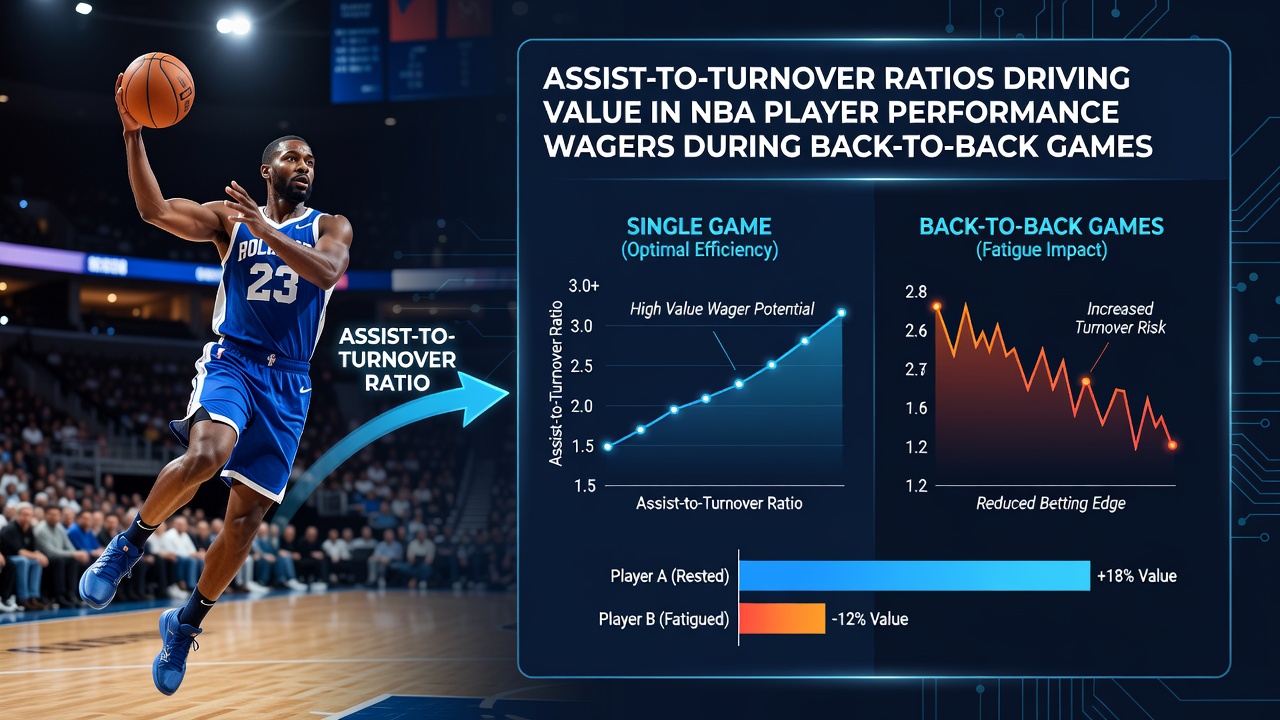
Assist-to-turnover ratios have emerged as a measurable factor that correlates with player output when teams play on consecutive nights, and analysts track these figures because they often reveal edges in performance wagers. Data compiled across recent NBA seasons shows that players maintaining ratios above 3.0:1 deliver assist totals that exceed season averages more frequently during the second game of a back-to-back set, while those below 2.0:1 post higher turnover counts that suppress their overall production. Researchers who examined box scores from 2024 through early 2026 documented patterns where point guards and wings with elevated ratios sustained efficiency even after travel and limited rest, creating measurable differences in prop betting outcomes.
Defining the Ratio and Its Components
An assist-to-turnover ratio calculates assists divided by turnovers for an individual player across a defined sample of games, and this single number captures both creation and ball security in one value. League-wide averages hover near 2.2:1 according to official NBA tracking data, yet starters who log heavy minutes often see their personal ratios shift when fatigue sets in during back-to-back schedules. Those who study the metric note that assists reflect successful playmaking while turnovers indicate lost possessions, so the ratio serves as a proxy for decision-making under physical stress. When teams face the second night of a back-to-back, minutes restrictions and defensive intensity frequently alter how these numbers play out compared with standard rest situations.
Patterns Observed in Back-to-Back Contests
Statistical reviews of back-to-back games indicate that players whose season-long ratio exceeds 3.5:1 record assist lines that cover over 52 percent of the time in the second contest, whereas players under 1.8:1 see their assist props hit at rates below 44 percent. Turnover props move in the opposite direction, with lower-ratio players exceeding their projected turnovers more often when legs grow heavy late in the second half. One study released by the Journal of Quantitative Analysis in Sports examined 1,200 back-to-back instances from 2023 to 2025 and found the ratio remained a stable predictor even after controlling for opponent defensive rating and travel distance. Observers note that teams in the Western Conference, which face longer flights between games, show amplified effects compared with Eastern Conference squads that encounter shorter trips.
Betting Market Applications
Prop markets on assists, turnovers, and combined performance lines adjust slowly to ratio-based signals because public bettors focus more on raw averages than situational splits. Sportsbooks that publish second-half lines during back-to-backs sometimes leave value on the table when they rely on season totals rather than rest-adjusted models. Figures from Nevada regulatory reports show that handle on NBA player props grew 18 percent year-over-year through the 2025-2026 season, with back-to-back slates accounting for a disproportionate share of that increase. Bettors who isolate players with ratios above league average in the second game of a set have identified edges that appear consistently across multiple seasons, particularly on unders for low-ratio players whose turnover props drift upward. And yet the market continues to price most props using unmodified season averages, leaving room for ratio-driven adjustments.
Player Archetypes and Position-Specific Trends
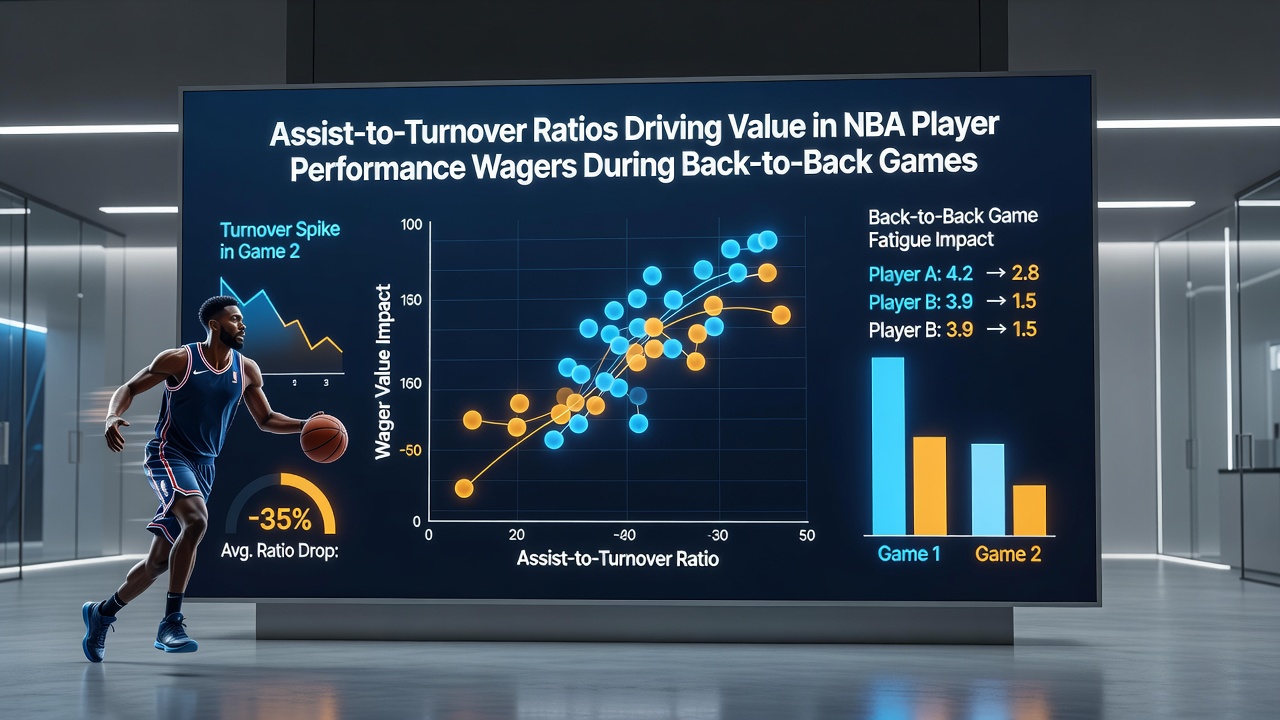
Point guards post the highest average ratios league-wide, yet their numbers drop more sharply than other positions when playing the second night of a back-to-back. Shooting guards and small forwards who operate as secondary creators often maintain steadier ratios because their assist opportunities arise from cuts and spot-up actions rather than primary ball-handling duties. Centers rarely post ratios high enough to move betting lines, but those who do, such as elite passers in pick-and-roll schemes, show outsized effects on team totals when their decision-making holds up under fatigue. Data from the 2025-2026 season indicates that players aged 28 and older experience larger ratio declines in back-to-backs than younger counterparts, a trend that aligns with recovery research published by sports medicine groups. Those who model prop outcomes incorporate age and position as interaction terms alongside the core ratio to refine projections further.
External Factors That Interact With Ratios
Travel distance, altitude, and schedule density all modulate how assist-to-turnover ratios translate into on-court results. Teams arriving in a new city after a cross-country flight post larger ratio drops on average than those who remain in the same time zone. Altitude effects documented at venues above 5,000 feet correlate with increased turnovers across the board, which compresses ratios even for players who normally protect the ball well. Schedule density during March and April, when teams often face three games in four nights, magnifies these patterns because cumulative fatigue compounds the single-night back-to-back effect. Regulatory filings from the Nevada Gaming Control Board through August 2026 record elevated wagering volume on NBA props during these compressed periods, suggesting sharp bettors have already begun layering ratio data into their models.
Conclusion
Assist-to-turnover ratios supply a quantifiable lens for evaluating NBA player props specifically during back-to-back games, and historical data sets demonstrate repeatable correlations between pre-game ratios and second-night outcomes. Markets that continue to price props without rest-adjusted splits leave measurable discrepancies that ratio-informed approaches can target. As tracking technology improves and sample sizes grow, these relationships should become clearer still, allowing for more precise adjustments across player props and team totals alike.